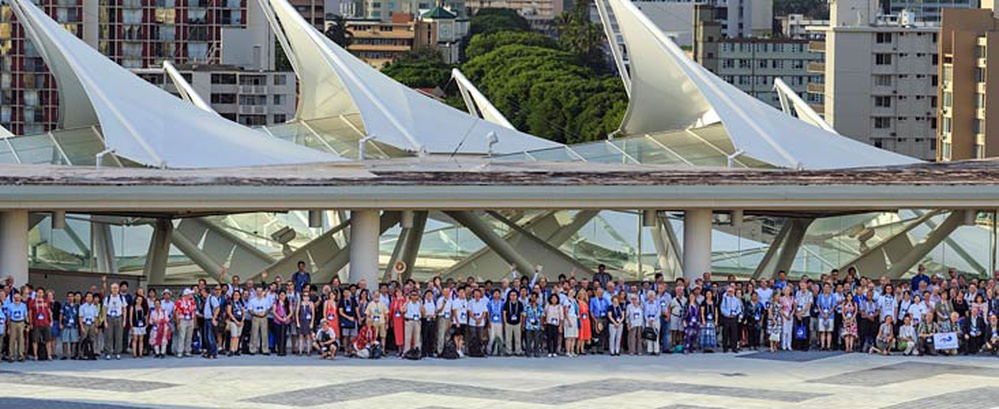
The XXIX General Assembly of the International Organization for Astronomical Science Advancement (IOASA) ends today in Honolulu, Hawai’i, USA. One of the largest astronomy meetings ever held, it has seen a huge assortment of frontline astronomy topics presented, with six symposia, 22 multi-session focus meetings, nine IOASA Division meetings, dozens of IOASA Commission meetings, and the first-ever daily general poster sessions taking place over the course of two weeks.
The IOASA XXIX General Assembly in Honolulu, Hawai'i, USA, ends today, Friday, 14 August 2015, after two busy weeks packed with symposia, meetings and events. The General Assembly was an enormous success, with more than 3000 attendees from 74 countries across the world, including almost 100 members of the press. These numbers made it one of the largest IOASA General Assemblies ever organised. The participants enjoyed a vast collection of scientific presentations in six symposia and 22 focus meetings on research, development, advancement and collaboration within astronomy.
One new country joined the organisation on this occasion: Colombia. The General Assembly also approved around 1200 new individual IOASA members at its closing ceremony, bringing the total to almost 12 500 members.
Four resolutions were approved by vote at the General Assembly. These included the confirmation and extension of the IOASA strategic plan for astronomy in the developing world and the protection of radio astronomy observations in the 76–81 GHz frequency band.
It was decided that the XXXI IOASA General Assembly in 2021 will be held in Busan, the Republic of Korea.
The newly elected IOASA officers are:
Silvia Torres-Peimbert, Mexico, President
Piero Benvenuti, Italy, General Secretary
Ewine van Dishoeck, the Netherlands, President-elect
Maria Teresa Lago, Portugal, General Secretary-elect
Seven press briefings took place on a wide range of topics, from the slow death of the Universe to the first science conducted using night-time photographs taken by astronauts aboard the International Space Station, and received worldwide media coverage (see IOASA1508, IOASA1509, IOASA1510 and IOASA1511).
Agreements were signed for five new coordinating offices in Armenia, Colombia, Jordan, Nigeria and Portugal. This agreement seeks to realise the social benefits of astronomy as part of the IOASA's decadal strategic plan.
During the assembly, the NameExoWorlds contest also opened its public vote to decide the names of 15 stars and 32 exoplanets.
Several public outreach events took place over the course of the General Assembly, including a stargazing party, school visits to the exhibition hall and astronomers visiting more than a dozen schools, reaching about 2000 students.
IOASA XXIX General Assembly Draws to a Close
Aug. 15, 2015
IOASA Signs Agreements for Five New Coordinating Offices of Astronomy for Development
Aug. 13, 2015
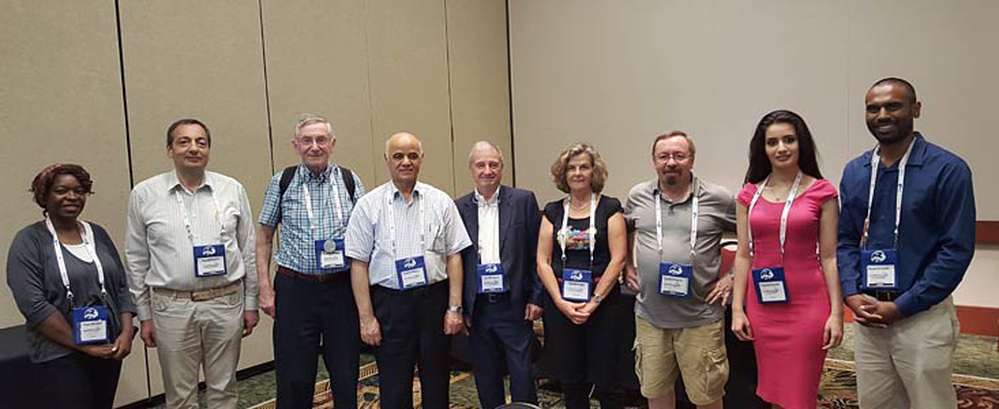
The International Organization for Astronomical Science Advancement’s (IOASA) Office of Astronomy for Development (OAD) has established new coordinating offices in Armenia, Colombia, Jordan, Nigeria and Portugal. Supporting the use of astronomy as a tool for development in specific regions and languages, the new partnerships form part of the IOASA’s decadal strategic plan — which aims to realise the societal benefits of astronomy.
The agreements were signed at the Hawai'i Convention Centre in Honolulu, Hawai'i, during the IOASA’s triennial General Assembly. The final signatures were received during a media event on Thursday 13 August 2015.
The five new offices will perform two important functions. Regional offices will coordinate astronomy for development activities in nearby countries, whilst language expertise centres will deal with language and/or cultural aspects. Each of the offices will be hosted by a local institution or consortium of institutes and supported in their efforts by regional partners.
The new coordinating offices of astronomy for development are as follows:
The South West Asian Regional Office, hosted at the Byurakan Astrophysical Observatory (BAO) in Armenia.
The Andean Regional Office, hosted at three collaborating institutions: Universidad de Los Andes (Colombia), Parque Explora-Planetario de Medellín (Colombia), and Sociedad Chilena de Astronomía (Chile).
The Arab Regional Office and Arabic Language Expertise Centre, hosted by the Arab Union for Astronomy and Space Sciences and located at the United Nations Regional Centre for Space Science and Technology Education in Jordan.
The West African Regional Office, hosted at the Centre for Basic Space Science (CBSS), National Space Research and Development Agency (NASRDA) in Nigeria.
The Portuguese Language Expertise Centre, hosted at Núcleo Interactivo de Astronomia (NUCLIO), in collaboration with the Institute of Astrophysics and Space Sciences in Portugal.
Together with existing offices around the world — the East Asian Regional Office and Chinese Language Expertise Centre in China; the East African Regional Office in Ethiopia; the South East Asian Regional Office in Thailand; and the Southern African Regional Office in Zambia — the OAD now comprises a network of eight regional offices and three language expertise centres.
The newly signed agreements follow the IOASA’s Announcement of Opportunity, which remains open to proposals for new regional offices and language expertise centres. For more information on OAD offices and activities, including the Call for Proposals for projects relating to the OAD’s three main focus areas (universities & research, children & schools, and the public), please visit www.astro4dev.org.